Data Access & Visualization
Shortly after starting the enrollment and as participants provide the data to your study, you can access the data and start the analysis. You can review the data on the Researcher Dashboard, use Avicenna's integrations to query and visualize the data, or export the data and use it in other tools. We discuss each of these below.
Activity Responses
Immediately after a participant completes an Activity session, Avicenna uploads
the responses to the server and makes them available to your research team. At any time, you can check the status of the
sessions in your study using the Activity Sessions page.
For survey activities, you can also check the responses on the Activity Responses page.

On this page, you can also choose to export the data as CSV for the chosen data source, all data sources, or all of the Activities. This process happens in the background and you will get an email as soon as the export is completed. You can always check the status of your export, or download the data via the Data Export page.
Exporting Data
You can use the Data Export page to export collected sensor data in a different format.

In order to export the data, you should select one or more participants and a data source. Depending on the type of data
you are exporting, Avicenna offers one or more different formats. You always have the option to export as CSV, but for
example, for GPS you may choose to export as KML or GPX as well. Further, you have to choose a date range for which
you want to export the data. When done, click on the EXPORT button to start the data export process.

Export files can be very large, sometimes up to multiple gigabytes. Avicenna will send you an email when the export is ready. Then you can download the resulting file from the Data Export page. Each data export is available for 7 days. Data exports older than 7 days are removed automatically and you can create them again if needed.
Visualizing Data
Avicenna allows you to access your data directly from the Researcher Dashboard, using Avicenna integration with the Kibana visualization tool. You can use this tool to query your raw data and visualize them in different forms. Below we will give you a quick introduction to how you can use this tool. You can learn more on Data Visualization via the Kibana page.
To access Kibana, on the Researcher Dashboard and from the left-side panel, click on Kibana. You will be taken to a
new page as shown below.

On the top left corner, you can choose the data table (or Index Patterns, as it is called in Kibana) you want to
connect to. The names are self-explanatory, and you should be able to easily find the data index you want to explore. By
default, as you see above, you are connected to the Bluetooth index.
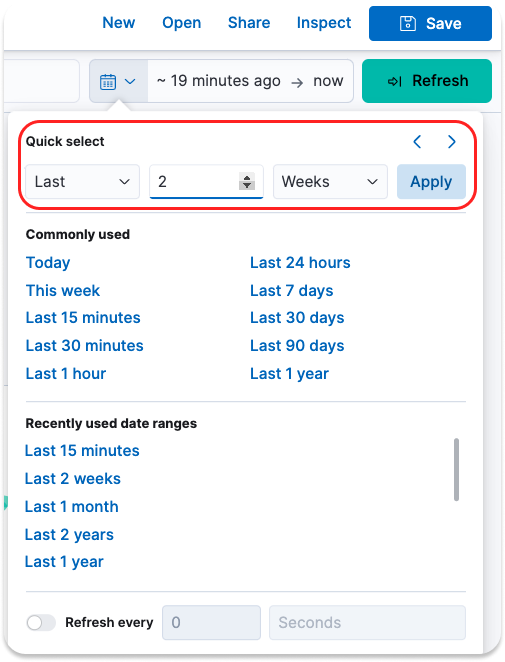
You also should choose a date range for which you want to see the data. By default, the date range filters only for the data that are received within the past 15 minutes. So chances are that you will see no data on the page. Here, we change this to the last two weeks.
As you can see, within this time window, our study has collected 963 GPS records.

You can filter the data based on any criteria, create graphs and visualizations based on this data, or create data dashboards by putting together your visualizations. We encourage you to read more about how you can use Kibana to visualize your study data in the Data Analysis documentation.
Audit Trail
Regardless of the type of study you are conducting via Avicenna, your study will involve a set of participants. For every participant in your study, Avicenna records all of their interactions with the app and reports it in real-time, as part of the Audit Logs. You can check these logs for each participant to help them navigate your study, or to troubleshoot the issues they might have, or just to use them at a later time as metadata during the analysis.
You can access the Audit Logs in Kibana via the audit trail index. To do so, on the Researcher Dashboard, click on
Kibana on the left-side panel, and select the audit-trail index. We just change the time range to Last 30 days:

From the list of data fields on the left side, we click on user_id, device_id, audit_log_type_name, and message.
We also click on the record_time column's title to change the sorting order to Sort Old-New. Now our report looks
like the following:

Above you can see different events that have happened, such as Participant read their registration status, Researcher opened the Basics page, and Notification updated. You can refer to the Audit Trail for more details on what pieces of information are available, and how they can be interpreted.
Where to Go Next?
In the previous sections, we learned some basic skills on how Avicenna works. We created a simple study and configured it to collect different types of sensor data. We programmed a few data sources and tried them out in the Avicenna app. We configured when and how often the data source should be prompted. We learned how to use the Criteria to add branching and skip patterns to our study. We explained what you should test before going to the field deployment, and what you should look out for while in the field. And lastly, we discussed how you can access your data and visualize them.
This should prepare you to start using Avicenna for your study. As you work with different parts of the system, we suggest referring to the Reference Documentation from the left panel to learn the details of how the relevant features work. You can also refer to the Tutorials for different recipes and how-to articles.
If you have any questions, you can always ask that in our forum. You can also email us at support@avicennaresearch.com.